Weekly Review
The major stock market indexes reached new record highs on Monday and Wednesday before ending the week modestly lower to snap an eight week winning streak. There was some profit taking on Thursday and Friday to coincide with Thursday’s release of the Senate’s version of a tax reform bill that seemed to depress investor sentiment.
The Senate’s version of tax reform called for a one year delay in cutting the corporate tax rate to 20% from 35% and maintained deductions related to mortgages and state and local property taxes. While the House and Senate versions are now headed toward a reconciliation process to hammer out their differences, uncertainty surrounding the ability of Congress to do just that created a cloud over the financial markets.
Investors are now more doubtful about the prospects for real tax reform. The House version tries to offset the steep cuts in the corporate tax rate by limiting the mortgage deduction and deductibility of state and local property taxes, and these proposals are proving to be highly controversial. Here’s a thought – pay for the tax cuts by cutting federal spending.
The economic calendar was very light with little in the way of data to influence the markets. As far
as mortgages were concerned, mortgage application volume was unchanged during the week ending November 3 from the prior week. The Mortgage Bankers Association (MBA) reported their overall seasonally adjusted Market Composite Index (application volume) remained unchanged. The seasonally adjusted Purchase Index increased 1.0% from the prior week while the Refinance Index decreased 1.0%.
Overall, the refinance portion of mortgage activity increased to 49.0% of total applications from 48.7% in the prior week. The adjustable-rate mortgage share of activity decreased to 6.6% of total applications from 6.8%. According to the MBA, the average contract interest rate for 30-year fixed-rate mortgages with a conforming loan balance decreased to 4.18% from 4.22% with points decreasing to 0.38 from 0.43.
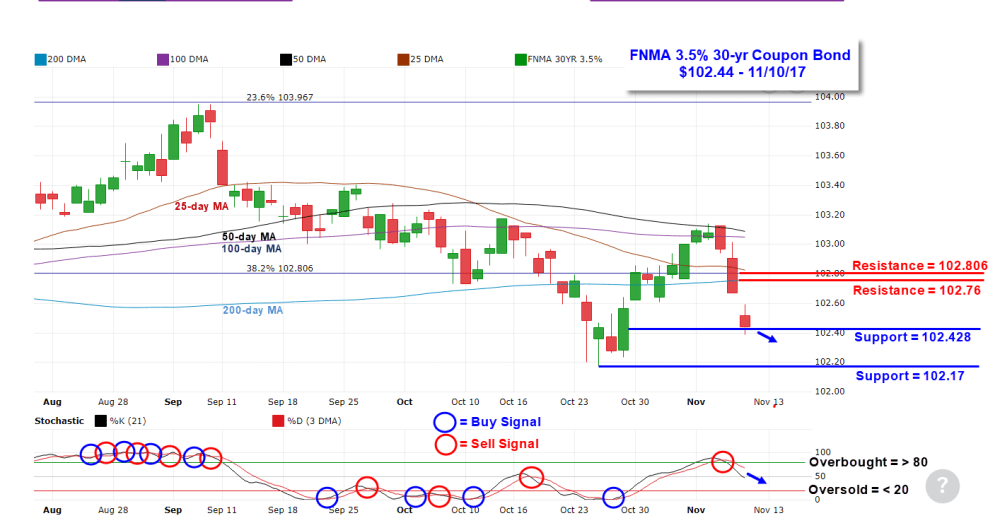
Mortgage Rate Forecast with Chart – FNMA 30-Year 3.5% Coupon Bond
This past week, the national average 30-year mortgage rate rose to 4.01% from 3.96%; the 15-year mortgage rate increased to 3.31% from 3.27%; the 5/1 ARM mortgage rate increased to 3.20% from 3.18% and the FHA 30-year rate remained unchanged at 3.60%. Jumbo 30-year rates increased to 4.18% from 4.15%.
The FNMA 30-year 3.5% coupon bond ($102.438, -56.2 bp) traded within a 75.0 basis point range between a weekly intraday high of $103.141 on Tuesday and a weekly intraday low of $102.391 on Friday before closing the week at $102.438 on Friday.
Mortgage bond prices continued higher at the beginning of last week, moving above the 100-day moving average resistance level last Monday and Tuesday before being turned away by resistance at the 50-day moving average on Wednesday. The bond then continued lower to fall below several support levels including the 25-day and 100-day moving averages along with the 38.2% Fibonacci retracement level. These now become technical resistance levels. New support levels have been identified at $102.428 and $102.17. A sell signal was generated last Wednesday on a negative stochastic crossover, and since the bond is not yet “oversold” a continuing decline toward secondary support at $102.17 could occur.
Therefore, we could see the bond continue to move lower to test support levels, and a move below these levels would lead to slightly higher mortgage rates.
 Jason Browning
Certainty Home Loans
Office # 972.599.5287
Cell # 214.587.0003
Jbrowning@certaintyhomeloans.com
NMLS: 527754